Improving UX of Financial Tools through Strategic Feedback Analysis and Tool Redesign


Overview
Organization
Financial Consumer Agency of Canada
Role
UXR Researcher
Team
Manager, UX designer and researchers, IT
UXR Skill
Competitive Analysis, Content Analysis, Sentiment Analysis, Low-fi Prototyping
Tools
Figma, Excel, PowerBI, Power Automate
Date
Oct. 2023 - May 2024
Business Goals
-
Develop a systematic data analysis process to extract consumer sentiments and suggestions for 8 tools.
-
Redesign the account comparison tool for better UX and to inform users about low-cost and no-cost accounts.
-
Scrape social media to identify the topics that most interest Canadians.
UXR Impact
Influenced product change:
-
Implemented UI changes in the account comparison tool via competitive analysis (launched).
Influenced product strategy:
-
Created Excel and PowerBI dashboards prioritizing consumer suggestions for 8 tools.
Increased stakeholder exposure to users:
-
Shared consumer needs in 8 tools with senior leadership and cross-functional teams at branch meetings.
Developed UXR infrastructure
-
Built framework for content and sentiment analyses.
-
Increased team's productivity by 45% by automatizing sentiment analysis via Power Automate.
BUSINESS GOALS
Enhancing User Experience of Financial Tools
The Financial Consumer Agency of Canada (FCAC) offers 8 financial tools, but they have remained unchanged for an entire decade.
One contributing factor is the lack of a systematic data analysis process to analyze consumer tool feedback. The agency’s objective was to enhance the user experience (UX) of these tools by establishing a systematic process for analyzing feedback.
Additionally, they wanted to identify the financial topics that most interest people in Canada via social media scraping. This data can inform the development of new tools that cater to the modern needs of people in Canada.
My role as a UX researcher was to:
Project 1.
1. Establish a systematic data analysis process and extract the sentiments and suggestions of consumers for each tool.
2. Prioritize consumer suggestions for each tool to facilitate swift cross-functional action.
Project 2.
Redesign the account comparison tool for better UX and to raise consumer awareness about low-cost and no-cost accounts.
Project 3.
Conduct social media scraping and analyze social media posts and identify most frequently talked about financial topics.
PROJECT 1: DATA ANALYSIS INFRASTRUCTURE
I independently devised the following steps and diligently executed them to establish a systematic data analysis process. These steps allowed me to extract consumer sentiments and suggestions for each tool.
Step 1. Identify the Right Analyses
I evaluated the following wo analyses to be appropriate:
-
Sentiment analysis to classify consumer feedback into different sentiments.
-
Content analysis to classify consumer feedback into interpretable suggestions and compliments and effectively prioritize them based on their frequency of occurrence.
Step 2. Choose the Right Tool
I selected Microsoft Excel as the primary platform. Here’s why:
-
Leveraging Existing Resources: Excel was readily available within the organization, making efficient use of our existing tools.
-
Minimal Training Required: Other team members could seamlessly conduct data analysis without additional platform training.
Step 3. Conduct Analyses
To ensure reliable data analysis across all 8 tools, I meticulously built a codebook for sentiment analysis.
Sentiment Type | Definition |
|---|---|
Mixed Sentiment | *Positive and negative emotions are present. |
Negative Sentiment | *Express the tone of blame and linguistic markers (e.g., !!!!) showing dissatisfaction. |
Neutral Sentiment | *No apparent +/- emotions expressed & give suggestions to the tool. |
Positive Sentiment | *Express positive emotions about the tool (e.g., this is fantastic). |
*Positive and negative emotions are present.
*Express the tone of blame, emotional complaints, and linguistic markers (e.g., !!!!) showing dissatisfaction.
*No apparent +/- emotions expressed & give suggestions to the tool.
*Express positive emotions about the tool (e.g., this is fantastic, thank you for the tool).
Automatizing Sentiment Analysis
To support team's need in reducing data analysis time, I automatized sentiment analysis via Power Automate.

Before Implementation:
Manually conducting sentiment analysis for one tool required an entire week.
After implementation:
The same sentiment analysis now takes just 30 minutes for one tool. Team members can simply click a button to initiate the analysis. 🚀🕒
For content analysis, I first created sub-categories that concisely captured the gist of consumer feedback. Each sub-category represented either a consumer suggestion or a compliment. I further grouped these sub-categories into higher-level categories.
Below shows a snippet of the table summarizing content analysis for a mortgage calculator.
Feedback Category | Feedback Subcategory |
|---|---|
Result Presentation | Want to specify the year to view in a summary table |
Present principal and interest amount as sum | |
Want to enter the start of mortgage | |
Want to enter fixed vs. variable interest rate | |
Input Option | Want to enter bank credit protection information |
Result Presentation
Data Fields
Following this systematic process, I transformed a raw dataset of 2500 consumer feedback into an organized dataset.

Before and After!

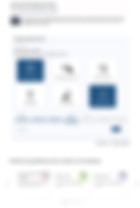
Step 4: Create Research Report
In crafting the research report, I opted for both Excel and Power BI dashboards. Here’s why:
-
Leveraging Resources: Utilizing the agency’s familiar tools ensured efficiency and consistency.
-
Quick Navigation: Audiences could easily switch between tabs to explore insights for all eight tools.
Filterable by Year and Feedback Type (Suggestion vs. Compliment)


Visualization of sentiment analysis.
The data showcased here is not authentic. It consists of fictitious data that I've utilized to illustrate the structure of the real dashboard and the methodology behind the data analysis process I employed.
Step 5: Deliver Stakeholder Presentation
I showcased the dashboards to senior leadership and cross-functional teams. By emphasizing the alignment with each team’s business goals, I effectively communicated the impact of our data analysis.
Senior Leadership
Emphasized how the dashboard effectively address the business question and provides a quick overview of prioritized consumer suggestions.
Communication and Media Services
Emphasized consumer suggestions of the tool related to tool marketing.
Program and Partnerships
Emphasized consumer suggestions related to writing and content.
PROJECT 2: ACCOUNT COMPARISON TOOL REDESIGN
The account comparison tool lets users to search for back accounts utilizing 8 search filters and they can compare the attributes of different bank accounts.
In this project, we had two goals.
GOAL 1.
Propose low-IT-effort UI modifications that give better UX & let consumers know of low-cost and no-cost accounts.
I collaboratively executed the following steps:
03 Conduct Gap Analysis
I identified the gap in the current tool, particularly how search filters for account fees were hidden under an expandable button.
I gathered technical requirements to understand the scope of UI changes that could be implemented with minimal IT effort.
I gave my weekly progress to the manager, who provided additional inspiration on design solutions.
04 Conduct Competitive Analysis
02 Identify User Needs
01 Gather Technical Requirements
05 Many 1:1 Meetings
06 Iterative Prototyping

I reviewed prior UX research findings and identified users prioritize account-related fees when searching for bank accounts.
I conducted a competitive analysis of government agency websites. This analysis gave me good ideas on effective ways to disseminate information to users.
I collaborated with a UX designer who provided technical feedback on prototyping and ensured that I followed user-centered design principles.
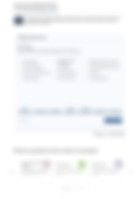
This collaboration resulted in the below low-fi prototype.

Proposed changes!

-
Change 1. Reordered 8 search filters so filters about account fees are shown at the top.
-
Change 2. Got rid of unnecessary phrases.
-
Change 3. Got rid of an expandable button to present all filters simultaneously.

Proposed change!
_edited.png)
-
Change 4. Included the label 'Low-Cost and No-cost Accounts' to accounts that are low-cost and no-cost.

Senior Leadership

IT Team


Business briefing note
Branch meeting
Refinement meetings
Regression testing
The prototype was shared with senior leadership via business briefing note, explaining how each UI change would enhance user experience of the tool and inform consumers about low-cost and no-cost accounts.
Our team, including me, and IT team reviewed the necessary backend system changes to implement the proposed changes.
I conducted a regression testing, ensuring the changes are working in a staging server!
The redesigned tool is now available to the public.
We had another goal in the project:
GOAL 2.
Create a blue-sky prototype to provide senior leadership with a long-term vision of how the tool could evolve.
To design a blue-sky prototype,
01.
I analyzed trending UI changes in financial tools through competitive analysis.
02.
Leveraging prior UX research, I pinpointed user needs specific to financial tools and translated them into actionable UI enhancements.
03.
Engaged in collaborative iterative prototyping with the team of UX researchers and designer.
The resulting prototype was shared with senior leadership via a business briefing note.
_edited.jpg)


PROJECT 3: SOCIAL MEDIA SCRAPING
I independently developed a research plan, and I will execute the project in 4 steps.
Step 1. Identify the Right Social Media
I compiled a list of Canadian social media platforms where people discuss financial topics.
Step 2. Conduct Scraping and Data Analysis (🚧Work in progress)
I will use R Studio and Python to scrape social media posts. I will reach out to the agency's engineers to understand how to use Python as a scraping tool (I am a beginner!).

I will then conduct descriptive statistics (e.g., frequency tables) to find out most talked about financial topics.
Step 3. Develop Findings Report
I will use Excel and PowerBI Dashboard to showcase results.
Step 4. Deliver Stakeholder Presentation
I will share findings with senior leadership and cross-functional teams and offer an answer to the question, "What new tools could the agency develop to fulfill the financial needs of Canadians?"
REFLECTION
FUTURE WORK
LESSONS LEARNED
-
Conduct user testing to compare the revised account comparison tool and current tool to see if consumers' awareness of low-cost and no-cost accounts have increased.
-
Understanding business, technical, and user requirements is crucial. I’ve learned that the key to delivering high-quality research outcomes lies in grasping these three aspects at the project’s outset. This understanding allowed me to come up with realistic UI changes and prioritize user needs effectively.
-
Know what resources are available. During my onboarding, I familiarized myself with the research tools and materials provided by the agency. This knowledge significantly informed my decision-making process and time and enabled me to create practical plans that align with our team’s research requirements.